Uncaught exceptions
NorthDuty listens for pageerror events — uncaught JavaScript exceptions that break page functionality — and includes them in the check result.
JavaScript error monitoring usually means installing an SDK and waiting for a real visitor to hit the bug. NorthDuty does it the other way round: every check opens your page in a real Chromium browser and reports the uncaught exceptions and console.error output it sees — with nothing installed on your site.
Start your 7-day trial — no credit card, free plan after.
Catch the script errors that break buttons while the page still looks fine.
Every health check captures front-end script failures the same way a real user's browser would.
NorthDuty listens for pageerror events — uncaught JavaScript exceptions that break page functionality — and includes them in the check result.
Meaningful console.error output is captured alongside page exceptions, so deeper front-end failures are visible without opening DevTools.
JavaScript errors count as critical failures in the errors component of the health score (20% weight). They directly affect the 0–100 score reported for each check.
No JavaScript snippet required. NorthDuty uses a real Chromium browser on every check, so errors are caught exactly as a visitor's browser would experience them.
Both approaches are useful and most mature teams run both. They answer different questions, so it is worth being clear about which one you need.
| What you want to know | Error tracking SDK (Sentry, Rollbar, …) | Synthetic browser checks (NorthDuty) |
|---|---|---|
| Errors from real visitors, with their browser and session | Yes — this is what an SDK is for | No — checks run from one controlled browser |
| Errors on a page nobody has visited yet | No — it needs a visitor | Yes — the check is the visitor |
| Code to install on the site | A script or package in your build | None; the page is loaded from outside |
| Stack traces mapped to your source | Yes, with source maps | No — you get the browser's error message and the page state |
| Errors caught during a checkout, login or form journey | Only if a real user completes it | Yes — the journey is run on a schedule |
| Noise level | Every visitor's extension, bot and network hiccup | Only what the page itself produces |
| Ties the error to page health and uptime | Separate tool and timeline | Same check as uptime, SSL and rendering |
| Useful before launch or on a staging URL | Needs traffic | Works immediately |
Not every console message matters. These are the ones that usually mean a visitor cannot finish what they came to do.
A TypeError thrown when the handler runs leaves the button rendered but inert. Add to cart, Place order and Submit all fail this way, and the page stays at HTTP 200 throughout.
A payment SDK, consent tool or tag manager that 404s or is blocked takes the flow that depends on it with it. The error names a domain that is not yours, which is the fastest clue.
A ReferenceError for a function that exists in your new code usually means a cached HTML page is loading a hashed bundle that no longer exists, or the reverse.
A failed API call with no catch leaves the UI in a half-loaded state — spinner forever, empty list, disabled button — and reports nothing to the visitor.
A tightened Content-Security-Policy header can block your own scripts. The console says so plainly; nothing else on the page does.
Logged-in staff get uncached pages and a different script set. Checking as an anonymous visitor is the only way to see what customers get.
An error tracking SDK reports what visitors experienced. That means the pages with the least traffic — a seasonal landing page, a newly launched product, step three of a checkout, a client site in its first week — are the ones you learn about last, and they are often the ones that matter most per visit.
Synthetic checks invert that. The schedule provides the traffic, so a broken script on a page with two visitors a day is caught in the same few minutes as one on the homepage. It is also the only approach that works on a staging URL or a page behind a campaign that has not started yet.
A count of exceptions is not much help on its own. What shortens the fix is knowing which URL, at what time, on which step of which journey, and what the page looked like at that moment.
NorthDuty records the check that failed, the browser's error output, and the state of the page when it happened, so the error arrives with the context you would otherwise reconstruct by hand. If the error happened inside a journey, the failing step is named.
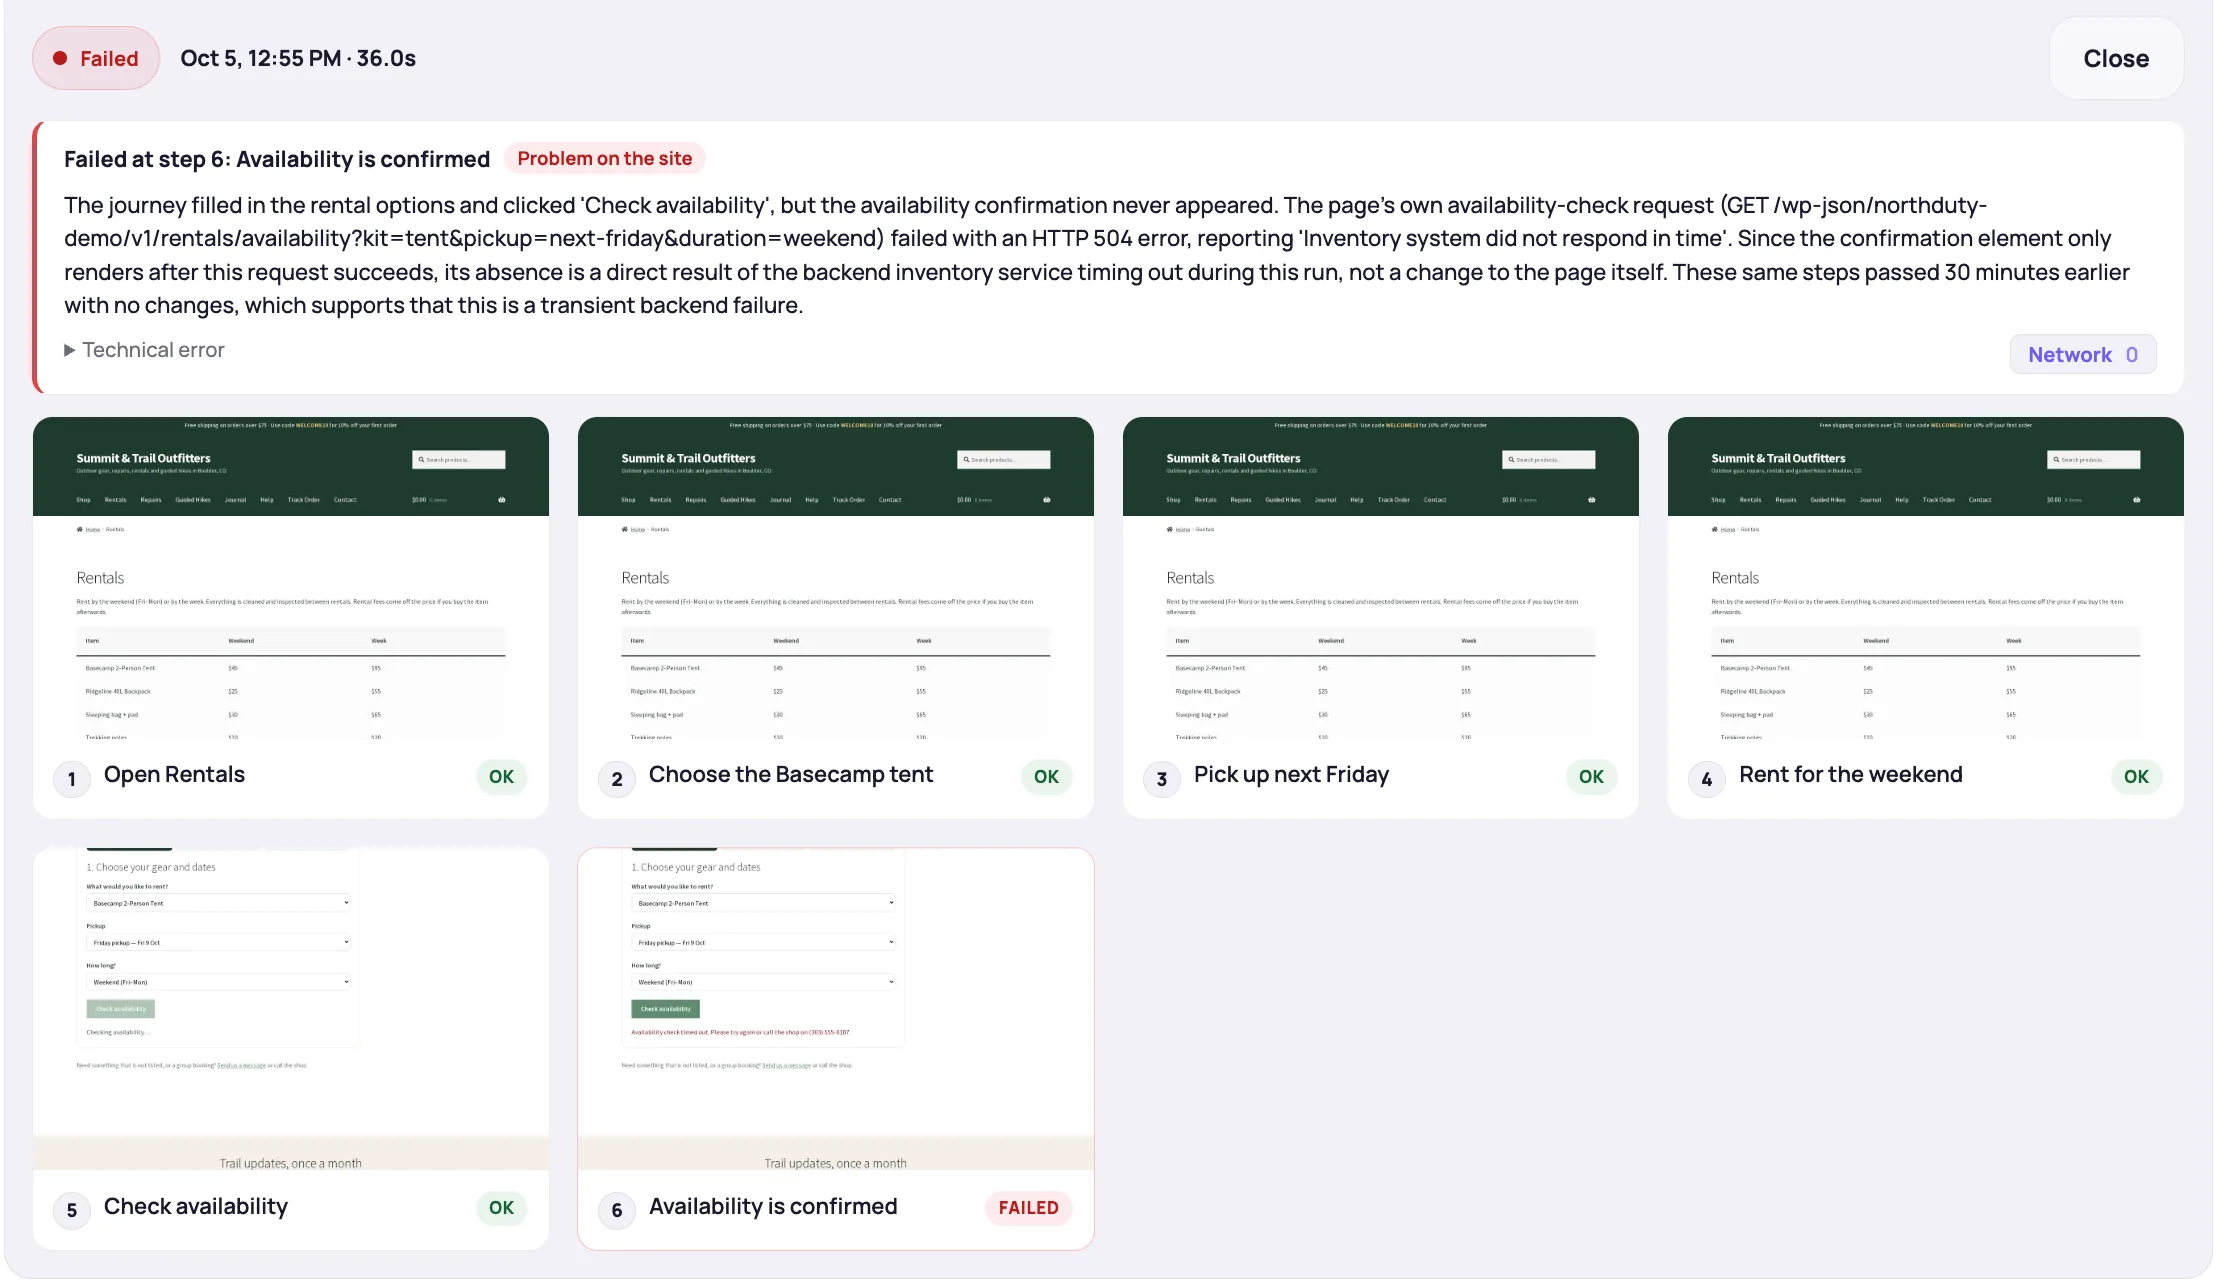
A page can return HTTP 200 while a critical JavaScript error prevents the checkout button, login form, or product page from working. Ping-based uptime checkers don't catch this because they never run the page's JavaScript.
NorthDuty runs every health check in a real Chromium browser. It captures uncaught JavaScript exceptions and meaningful console.error messages, reports them in the health timeline, and uses them to calculate the errors component of the health score.
Most website failures in production are front-end failures — not server outages.
JavaScript error monitoring is automatic on every health check. No setup beyond adding a URL.
Create a project and add your site URL. Health monitoring, including JavaScript error detection, starts automatically.
Each run launches a Chromium browser, navigates to the page, and captures any uncaught exceptions or console.error messages.
Failed script checks are included in the run result and reduce the errors component of the health score.
Use a 'health score below' alert rule to get notified when JavaScript errors push the score below your acceptable threshold.
Explore pricing, feature details, solution pages, and related tools connected to this website monitoring use case.
Pricing
NorthDuty plans are sized by how many checkout, signup and login journeys you monitor: Free, $29 Starter, $79 Pro, $199 Business. 7-day trial, no card.
Compare pricing plansHub
Explore NorthDuty features: coverage-aware AI journeys, a cross-site workspace overview, website health checks, and connected incident response.
Browse FeaturesHub
Explore NorthDuty solutions for ecommerce website monitoring, SaaS website monitoring, agency website monitoring, and startup website monitoring.
Browse SolutionsFeature
Monitor uptime every 5 minutes by default with HTTP, SSL, DNS, blank-page detection, broken resources, JavaScript errors, and API call tracking.
Explore Uptime MonitoringFeature
Monitor website performance signals, response timing, and rendering context on the pages and journeys that affect revenue, leads, and trust.
Explore Website Performance MonitoringFeature
Automatically run health checks and user journeys the moment your site is deployed or your CMS publishes a change.
Explore Deployment MonitoringComparison
Looking for a Sentry alternative for website monitoring? Compare NorthDuty vs Sentry for proactive website health and user journey monitoring.
Compare SentryFeature
Send NorthDuty alerts to email, Slack, Teams, Discord, Google Chat, webhooks, Telegram, WhatsApp, and SMS.
Explore AlertingArticle
Two ways to monitor JavaScript errors: an SDK that reports what real visitors hit, and a scheduled browser check that finds them without touching the site.
Read How to Monitor JavaScript Errors on a WebsiteArticle
Eight causes of blank pages on websites, the status code each one returns, how to confirm it, and why five of the eight never trigger an uptime alert.
Read What Causes Blank Pages on Websites?Hub
What breaks after deploys and updates: broken checkouts and forms, blank pages, JavaScript and API failures, third-party scripts, redirects, and launch checks.
Browse Deploy & regression guidesAnswers to common questions about this monitoring feature and when teams should use it.
Yes. Every health check runs a real browser that captures uncaught JavaScript exceptions and console.error messages. No setup beyond adding a URL.
JavaScript errors count as critical failures in the errors component of the health score (20% of the total). They directly reduce the 0–100 score.
No. NorthDuty checks your site externally from a real browser — there's nothing to install on the site itself.
It monitors exceptions rather than tracking them per user. Each scheduled check opens the page in a real browser and reports uncaught exceptions and console.error output, so you learn that the page is broken and when it started — without an SDK, source maps or per-session data.
Yes. A journey runs the steps in a real browser, so errors thrown while adding to cart, submitting a form or signing in are captured against the step that failed, not just against the landing URL.
Checks run in Chromium, so a bug that only appears in Safari or Firefox will not be caught. For cross-browser bugs you still need real-user reporting or manual testing; synthetic checks cover the far more common case of a script that is broken everywhere.
Sentry monitors errors from real user sessions using an installed SDK. NorthDuty monitors errors from scheduled synthetic checks using a real browser — a complementary approach that catches errors before users do, on the pages and routes you choose to monitor.
Monitor JavaScript errors on your most important pages with a real browser — no installation required.
7 days with Pro features and limits, no credit card — then keep one daily journey on the free plan.